Sunday, April 30, 2006

Forex Trading Breakout Strategies No3

Upward Breakout from a Downward trend - USDJPY

Following on from our strategy for taking advantage of an upward trend. Today we will look at another trading opportunity, using a downward trend as an example.

As well as trading the emerging trend we can sit on our hands and do nothing. Why? Well, trends don’t last indefinitely and a reversal will eventually happen. We spot reversals by breakouts from our trendlines.
In our picture, as the currency bounces up from our support it crashes right through our resistance. However, as we are being prudent we wait for confirmation that it is a true breakout. Confirmation does not come as the next two candlesticks from our breakout are bearish. After a short return to the downward trend we see a series of bullish indicators and watch the trend reverse over the next couple of hours (while we sit on our hands and do nothing!) Confirmation of the bullish move - to my mind - comes after the hollow spinning top. With our growing knowledge of the Japanese candlesticks, we enter our buy trade. Take quick profits or watch the trend develop, depending on your risk tolerance. I took quick profits - sure enough shortly after I cashed, out the developing upward trend fizzled out and dropped through my support line.

To be truthful the diagram above is not the best example of this type of trade. But in keeping with the tone of this blog I am trying to give examples of REAL trades, which I have personally done. Theory after all can prove anything!

Also with trades such as this I prefer to use a trailing stop loss (TSL) More of which later in the week as I discuss risk management.
Subscibe to my Newsletter Click Here!
  • Atom Feed
  • XML
  • Friday, April 28, 2006

    Forex Trading Strategies For A Sideway Market

    Before we look at our strategies for trading the sideways market, let's have a look at the spinning top Japanese Candlestick we saw in our trade yesterday.

    Japanese Candlestick Reversal - The Spinning Top
    The Spinning top is another reversal indicator which, when coupled with other data, can be a good sign that the market is about to do an about face! The smaller the central body (which can be filled in or hollow) the less current direction the market has. In this case the body is solid meaning the open was HIGHER than the close.

    As I mentioned above, in yesterdays trade you can clearly see the spinning top before the subsequent upward movement.

    Now, onto our ideas for trading in the sideways market.

    As with our upward and downward trends, a sideways trend is an excellent money making opportunity. After a big movement the markets will usually enter a period of relative inactivity. (this can also happen before an important news announcement)
    We can clearly see our support and resistance trendlines, in this case forming a channel. We are now looking for a breakout from this channel – either up or down – to enter our trade. It is very important to set a good margin for error when attempting these kinds of trades, as there are frequent ‘false breakouts’. One formula for doing this is to use the width of the current sideways trend as a marker for sell entries and buy entries.

    To clarify, if the width of our current sideways movement between support and resistance is 20 pips say. We set our buy point at 20 pips above resistance, and our sell point 20 points below. However, there really is no substitute for watching the chart unfold and paying close attention to any indicators in the emerging candlesticks. These will often become repetitive during these periods of inertia, so particular attention is required. We can of course trade the width of the channel while our trade bounces between support and resistance. But we need a decent pip range to risk this - I would say 30 Pips+

    There is a trade, demonstrating this technique in the real world already on this blog, if you click Here
    Scroll down the page to read about the trade.

    Happy Trading!
    Subscibe to my Newsletter Click Here!
  • Atom Feed
  • XML
  • Thursday, April 27, 2006

    Enter and Exit Strategies using Trendline and Japanese Candlesticks

    Why Do We Enter Or Exit a Trade

    So over the last few days we have looked at upward, downward and sideways trending markets on our forex charts. I hope you've been practicing! Now we are going to look at entering and exiting trades using this information.

    In our first real example from Sunday 23rds Asian open, we have a nice EURUSD trade during an upward trend.
    We notice a trend forming and decide it has all the requirements we need. Nice slope (45 degrees, or there abouts) three points of contact with our trendlines. Bullish candlestick formations when it approaches the trendline at support.

    When we see the trend confirmed, with the next bounce from support on our trendline - We enter our buy trade. We watch our trend continue in the anticipated direction.

    Our trade continues in keeping with our predicted direction until we see a very clear indication that the trend is likely reversing. A bearish morning star doji briefly touches our resistance trendline, prompting me to close out the trade for a nice profit.

    But, this is such a clear sign of reversal I decided to re-enter a sell order and follow the trade down. I decided, at this point, to recalculate the pivot points ( multi color horizontal lines on the chart ) and as soon as we reached our bottom point of support - the red line - a spinning top appears followed by a bullish candlestick so I exit the trade as this is also a clear reversal sign. You will see how our previous upward trend has been completely broken and we are now looking for the emergence of the next trend.

    I decided to stand aside for the upward movement until there was another clear candlestick indicator. At the top of the movement there are a couple of bearish candlestics and I enter a sell order for the probable reversal. It looks like there may be a move to trade between the pivot indicators as the reversal is preceded by three tests at the highest point of resistance, but I exit the trade soon after (for a 10 pip profit) as I don't want to push it. I also decide not to trade for the rest of the day.
    I have made a significant profit of double figure pips. All with the use of some very basic Japanese candlestick knowledge and a couple of trend lines!

    To recap;-
    Allways look for 3 points of contact on our trendlines.
    Allways get confirmation of the direction from the candlesticks
    Allways close out the trade at the first point of breakout.

    Tomorrow we'll look at that spinning top candlestick in greater detail

    Good fortune!
    Subscibe to my Newsletter Click Here!
  • Atom Feed
  • XML
  • Monday, April 24, 2006

    The Sideways Trend

    Sideways Market

    The sideways trend is usually seen after an upward or downward market movement. I think it represents a great opportunity for trading, and I love it when I see the market moving sideways – Because it can’t stay that way forever!

    Click to enlarge
    As we see in our screenshot, after an upward movement our currency pair is bouncing sideways over a 34 pip range. We place our trendlines on the support (bottom) and resistance (top) price points, and await a move outside the range. In this case we wouldn't want to risk trading the 34 Pips up & down (well I wouldn't!) Also notice in our image how there is huge gapping - bottom right hand corner - as the Forex markets close and open in different regions. Wouldn't want to get caught the wrong side of a move like that! Over a 100 pip drop.

    OK let's try to demystify our Japanese Candlesticks a little more, with a couple of bearish indicators.

    Todays Japanese Candlestick - Gravestone Doji
    As you might expect these are seen at the tops of an upward trend. As with the Dragonfly we saw on Saturday, the Gravestone has a long tail or wick (but in the opposite direction) and is a stronger indicator of a possible downward movement emerging than the shooting star below.

    Shooting Star. Possible downward move imminent! Note how our Shooting Star, at the top of our cluster of candlesticks, is followed by a swift downward reversal from the previous upward movement. These are often much "stubbier" with a short body, so keep an eye open, they could mean a profit opportunity is aproaching.

    Ok - more later Happy Trading!
    Subscibe to my Newsletter Click Here!
  • Atom Feed
  • XML
  • Saturday, April 22, 2006

    Examples Of A Downward Trend

    The Downward Trend.

    Yesterday, we looked at the upward trend. As you might imagine, our downward trend is the opposite of the upward. As usual we are looking for a downward slope of round about 45 degrees, to ensure that our trend looks sustainable enough for us to get in and make some profit.

    Click to enlarge
    Depending on the width of the trend (support and resistance lines) you may find good opportunity to enter and exit trades for some quick profit ( in our image it is 60 Pips or so) . Make sure you know what the bid offer spread is if you try this. – it can make all the difference!

    Todays Japanese Candlesticks - Dragonfly Doji

    This is what is known as a Dragonfly Doji. Often seen at the bottom of a downward trend, our long downward ‘tail’ or ‘wick’ could indicate a bottoming out and reversal.
    These Dragonfly Doji are a stronger indicators than the Hammer shown below.

    Bullish Hammer

    Thats all for now - See you next time
    Subscibe to my Newsletter Click Here!
  • Atom Feed
  • XML
  • Friday, April 21, 2006

    In Forex - The Trend Is Our Friend

    The Trend is our friend?

    This an old adage when it comes to trading. Whether it is Stocks or Forex, it still holds true. But what do we mean exactly?

    Simply this, it’s better to go with a trend than against it. To truly get the benefit of this strategy we need to be able to recognize and interpret the trend. This can take the form of reading charts and Candlestick patterns. - without a doubt one of the most basic but important skills to acquire in Forex trading.

    A currency pair can be trading sideways, up or down - and if we can read the signs we can make money in all three of these situations.

    If we understand what we are seeing we can make a deliberation on the probable outcome of the emerging data. A trend needs at least 3 points of reference to be relevant.

    There are various trends and Forex chart patterns to be aware of. These give us, as traders, a probable indication of direction in the future.

    When we add the charting knowledge to our growing understanding of Japanese candlestick formations – we are starting to acquire some powerful prediction tools.

    In an upward trend, our trendlines are sitting on successive higher lows or higher highs. Although in real trading the lines are rarely tidily drawn! As seen in this image

    Upward trend.


    The bottom line is showing us the support points of our current trend. The top line is showing us the resistance. In an upward trend our support point is constantly rising and our resistance price point is constantly rising also.

    We must also look at the steepness of our trend. An upward trend with a very steep incline is usually very short lived – hopefully it doesn’t die before we’ve taken advantage!

    Further Japanese Candlesticks - The Doji


    The Doji candlestick is interpreted as a sign of pending reversal. There is no real body, as the opening and closing prices are in close proximity. This means neither the Bulls or Bears have the upper hand.
    As a word of caution, we should always have a further confirmation before acting on the Doji.
    But, when added to other indicators and other candlestick patterns the Doji can be a powerful indicator. For example, if our current trend is up – we need a closing price below the close of our Doji to confirm that the trend is in-fact reversing.

    More next time. Cashmaster Out.
    Subscibe to our Newsletter Click Here!
  • Atom Feed
  • XML
  • Friday, April 14, 2006

    Forex Trading Using Fundamentals Or Technical Analysis

    Trade the news or trade the data?

    There is continuing debate as to whether it is more profitable to trade the news or trade the data from the charts. This is called trading fundamentals "trading the news" or, in the case of trading the data - Technical Analysis. Personally I trade on the data most of the time, whilst keeping an eye on the news feeds (more on news feeds in a moment) I keep an eye on the newsfeeds and economic calendars for two reasons.

    1) To ensure I don’t enter a trade when there is an important economical announcement imminent.

    2) To verify if the effects I am seeing on a currency pair are due to the news announcement or imminent news announcement.

    I think the general consensus on “trading the news” is NEVER enter a trade before the news is announced – You can get caught badly if the news is not as expected (as the ECB announcement last week, which was the total opposite of expectations)
    If after you read the announcement, you see the market moving in any one particular direction – then you can decide if you want to enter the trade, if you think the trend will continue (or reverse) . Again there is debate here, but most successful forex traders will wait for the market to settle down after it’s made a major move, before trading again.

    So, where do we find these newsfeeds, and how do we read them. The first thing we are going to need is a news reader. There are many free ones on the web (and we like free stuff!) I use Googles free news reader. Google also has a nice info page and tour of their reader. Google newsreader info

    So now we have our reader, what do we read on it? There are many newsfeeds online, I use CNN newsfeeds . Follow this link to add many interesting feeds to your reader. Bloombergs newsfeeds are also excellent and seem to be updated more frequently than some of the others. A lot of the Forex trading platforms also offer news alerts. Sometimes they charge for this, sometimes it’s free. Personally I don’t think anyone should pay for news reports when there is so much free information online.

    Another free resource, which is invaluable is Bloombergs economic calendar. Here you can keep your eye on upcoming economic announcements due in the week.

    Whether or not you decide to be a fundamentals man, or a technicals kind of guy is up to you. Personally I prefer reading the charts and learning to analyze the data, and I think it’s key to long-term successful forex trading.

    Finally, a little anecdote to lend a little brevity to the subject.

    A university professor was talking to a technical analysis expert.

    “Why don’t you come down to my classroom, as I’m giving a lecture all about economics and how the global economy and world events impacts the world currency markets. – I think you’d find it very interesting.”

    To which our Technical analysis expert replies.

    “Wow professor that does sound fascinating, and I’d love to come. But, as I’m a bit busy at the moment, why don’t I fly you up to New York on my private jet – and we can discuss your theories over lunch at the Four Seasons.”

    Happy trading, and good luck!

    Subscibe to our Newsletter Click Here!

    Tuesday, April 11, 2006

    Placing The Trade On Meta-Trader 4

    I thought I would post a quick description of how to enter and closeout a trade using the meta-trader 4. Also, if you scroll down, there is an interesting trade on the USDJPY.

    First the trade - I like to enter my trades in this manner. We have our EUR/USD chart open and we see an opportunity unfolding. We think the price is going to rise. At the top of the screen we see the ‘New Order’ button with the green cross. Clicking on this, gives us the order placing window. Do Not enter any stop loss or take profit at this time. Click the ‘Buy’ button. Our order is confirmed and we click ok. The reason we do not enter any other info at the time of placing the order means we save valuable time and avoid the price moving from the price at which we saw the opportunity.

    Right, now we can go back into our trade and modify the information to add stop losses and take profit signals. At the bottom of the screen you will see the trade you have just entered. Double click on the trade and our execution window reveals itself again. In the drop down menu select ‘Modify’. Then enter a stop loss at approximately 20-30 pips under the price we went in at. EG; if our trade is a buy order at 1.2050and we are expecting the price to rise, we would place a stop loss at 1.2020 . We do this to limit our loss if the trade goes against us. We then enter our take profit. We look at our chart and we decide the price will probably reach 1.2100 . so we place our take profit at 1.2095 to make sure we get our profit. Click on the long button to confirm. You will see on your chart that we now have three lines. A green dotted one, which is our entry price - and a red dotted one above and below the green one which are our take profit and stop loss. Now when the price reaches either of our red lines the platform will automatically close the trade.

    To manually close out a trade, simply double click on the trade at the bottom of your screen. Click on ‘Close’ and the platform will exit the trade for you. You will see the proceeds from the trade reflected in your balance.

    There are a couple of other options which we will explore later! But these will get you started and are a good habit to get into.

    Some screenshots of a recent trade on the USDJPY

    Fig 1 (Click to enlarge)


    I noticed that the pair had possibly started to trade between two points on the pivot charts (more on pivots later) The blue line representing the possible top/resistance, and the pink line possible support. After seeing confirmation of the probable top with a bearish candlestick (filled in) I entered a 'Sell' order at 117.66 . Our trade proceeds to fall as expected. AsI entered four lots I decide on a reverse pyramiding technique, which is stripping half the trades in profit out as the trades progress. I strip the first two trades out at 117.47.


    Following the trade down (Fig 2). I noticed a possible double bottom and, being the nervous type, closed out half the trade again at this point. 117.40 . The trade then bounced back up possibly confirming a reversal, and I closed the remaining trade at 117.47 Leaving me with a profit of 81 pips or $810

    The trade actually continued down to my first estimate, but hindsight is allways 20:20 isn't it :-)


    That's all for now - see you next time.

    Sunday, April 09, 2006

    What Are Pips or Points In Forex?

    So, What is a Pip?

    A pip or point as they are sometimes called is the smallest percentage increment listed on the currency pair.
    For example, if our currency pair is trading at 1.2245 and during the day reaches 1.2250 it has moved 5 pips/points. On a standard account each pip is worth $10, on a mini account each pip is worth $1 for the USD, GBP, AUD.
    For the CHF, CAD and JPY the pip values are $7.60, $7.30, and $8.45 on a standard account varying to $0.76, $0.73 and $0.85 on a mini

    The Major currency pairs are;-
    EUR/USD
    GBP/USD
    AUD/USD
    USD/JPY
    USD/CHF

    The minor or cross currency pairs are;
    EUR/GBP
    EUR/JPY
    GBP/JPY
    EUR/CHF

    There are of course many others.

    I would say trade one pair first to get used to the platform and the market. The EUR/USD is the probably the most popular as it offers low bid/offer spread.

    Candlesticks

    As explained previously, candlestick formations can be very usefull pointers for determining the markets current state of play - as well as future movement. It really is fundamental to have at least a basic grasp of the concepts.

    Fundamentals.

    Bullish Candlestick (click to enlarge)


    The ‘Hollow’ candlestick denotes a bullish period. These can be interpreted as a period when the market is in, or about to go into an upward movement.

    Bearish Candlestick (click to enlarge)


    Bearish candlesticks appear ‘Filled in’ and can be interpreted as a possible downward movement marker.

    In our example below the movement between the Bearish movement and Bullish movement can be clearly seen.


    Thanks for reading and happy Forex Travels.

    Thursday, April 06, 2006

    The Basic Setup For Forex Currency Trading.

    What are we going to need to get started?
    We are going to require a decent computer with a fast reliable internet connection. Trading software. I use meta-trader 4, which has all the charts and functionality you will need – and it’s free!
    A broker account. There are a number of reliable brokers out there. I use Interbank FX but any of the popular brokers will suffice - providing they meet the requirements below.
    What requirements do we need? Well I would say we need the following.
    1)Honesty
    2)Reliability
    3)Security of Data and personal information.
    4)Functional software integration
    5)Minimum slippage
    6)Charting packages
    7)Reasonable bid/offer spread8)Both Mini and Standard accounts offered.
    9)Demo account

    1 & 2 can be researched on the many forums (try MoneyTec & Money Maker )

    Number 3 is important, as you will eventually have real money in the trading platform. Call the company if they have a contact number and ask about their security measures. Their sites probably have this info also – DO YOUR DUE DILLIGENCE THIS IS IMPORTANT! Here is a Link to Interbank FX’s FAQ page where they answer some of these questions.

    4. Does the software (MT4 for example) integrate into your account? Or do they have their own software. This may be a bit of a bind later, if you decide to change brokers and have been using their proprietary dealing platform.

    5) Minimum slippage. This is the difference between the price shown on the screen and the price you actually end up paying when the order is placed ( as well as the spread of course). Again, you can try asking them if there is any slippage. Ultimately, you won’t really find out until you start using the platform. I’ve found using MT4 on Interbank FX to be pretty seamless, and they claim zero slippage.

    6)Charting packages again won’t be a problem if you go for MT4, as the software contains everything you need.

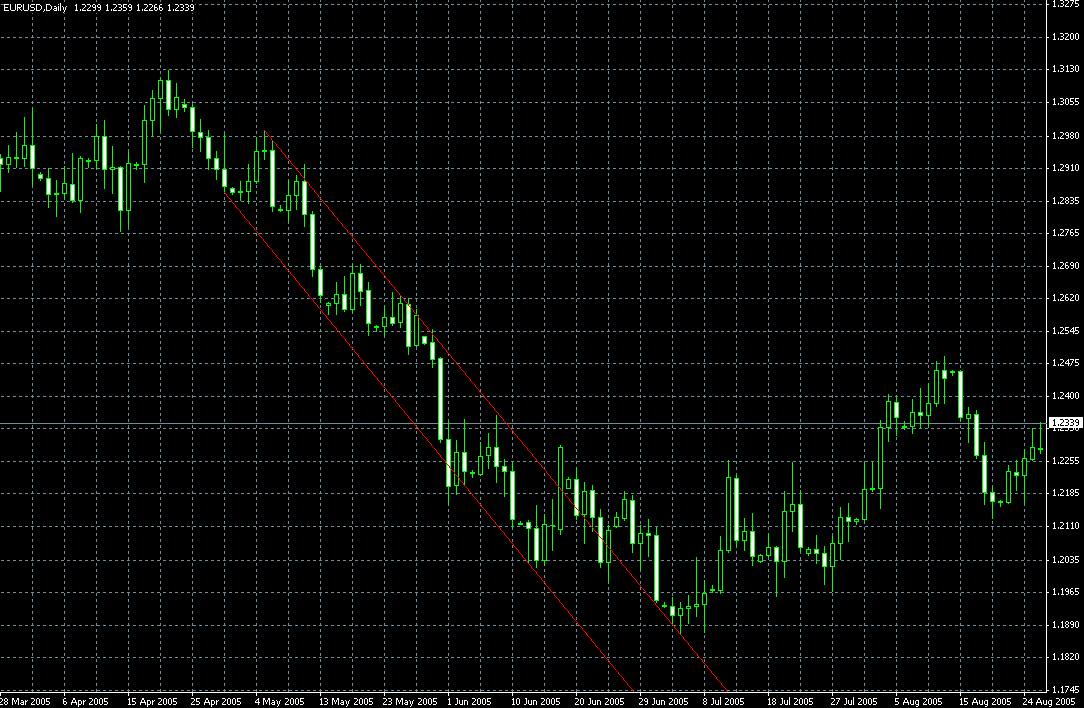
    7)Bid/Offer spread is the difference between the price you see on screen and the price you pay. This is one of the ways the broker makes his money.
    EG;- if the spread on the EUR/USD is 2 pips/points and the price on the screen is 1.2265 to place a buy order you would pay 1.2267 (2 pips over) to place a sell order you would pay 1.2263 (2 pips under) . N.B. Spread varies according to currency pairs, so always check before you enter a trade to see if you think the spread can be covered by the expected move.

    8)Standard accounts usually have a $5000 minimum opening deposit. Whereas Mini accounts have much lower minimums. Usually around $250 , but sometimes much lower.

    9)Demo Accounts are essential if you are going to learn to trade effectively. Even after you are an experienced trader, you will want to keep a demo account for practicing your new theories. To begin with you are ONLY going to be trading on a demo account with fake money. That’s if you are sensible – which I’m sure you are!

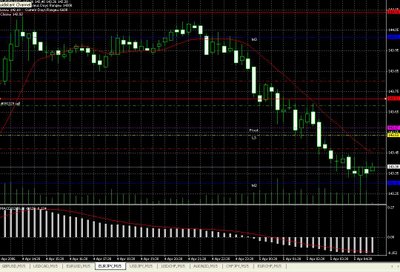
    As Promised I'm going to attempt to publish details of some of my trades. Here's a recent trade on the EURJPY.

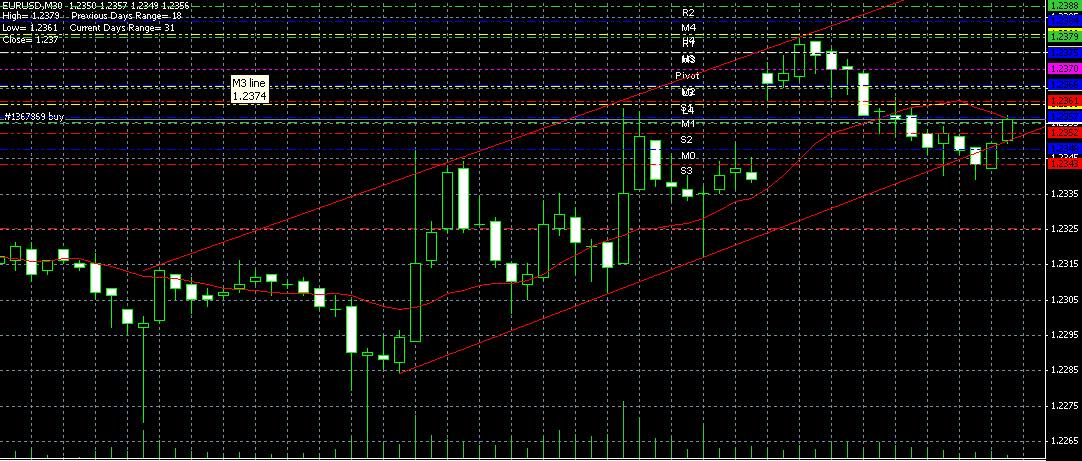
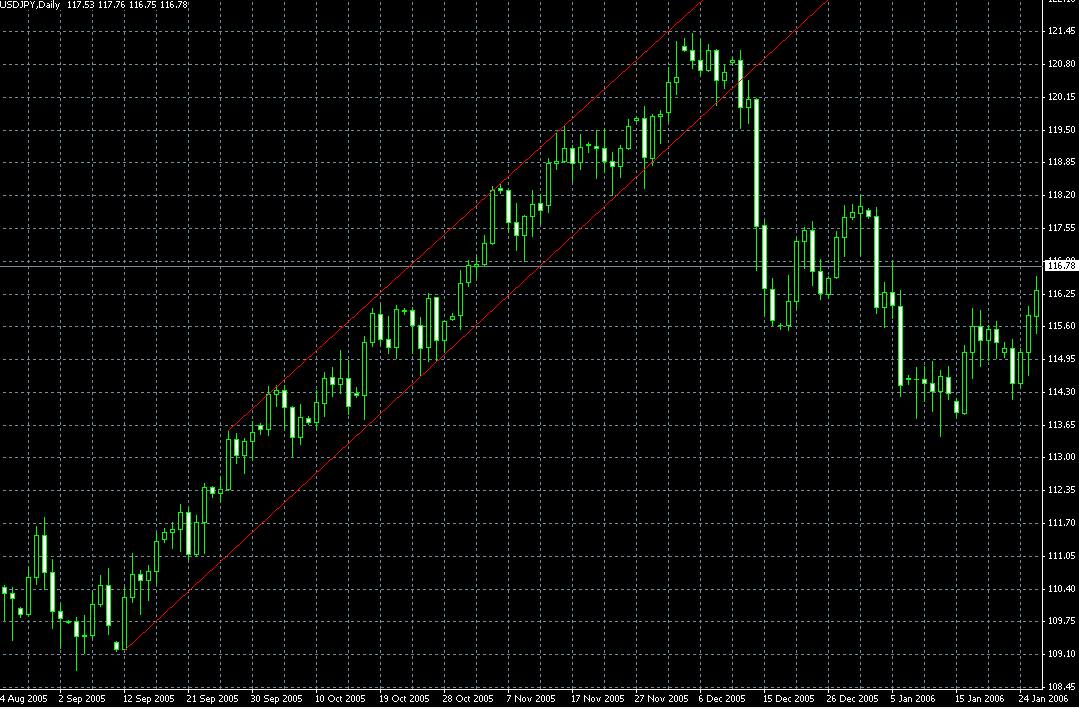
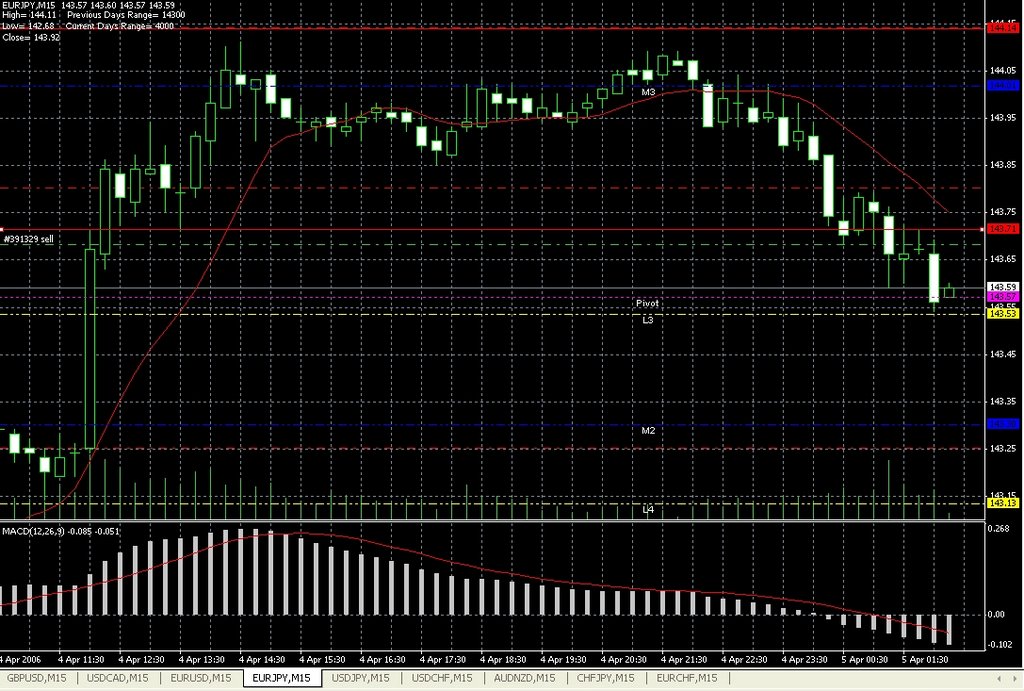
    Fig:1(click to enlarge)
    As you (hopefully!) can see in the above image, I had noticed the pair trading sideways between 143.71 & 114.40 - this is indicated by the two red lines I placed on the chart. As I saw a drop below the channel appearing, I waited for confirmation that this was indeed a breakout from the trend and entered my trade at 143.68

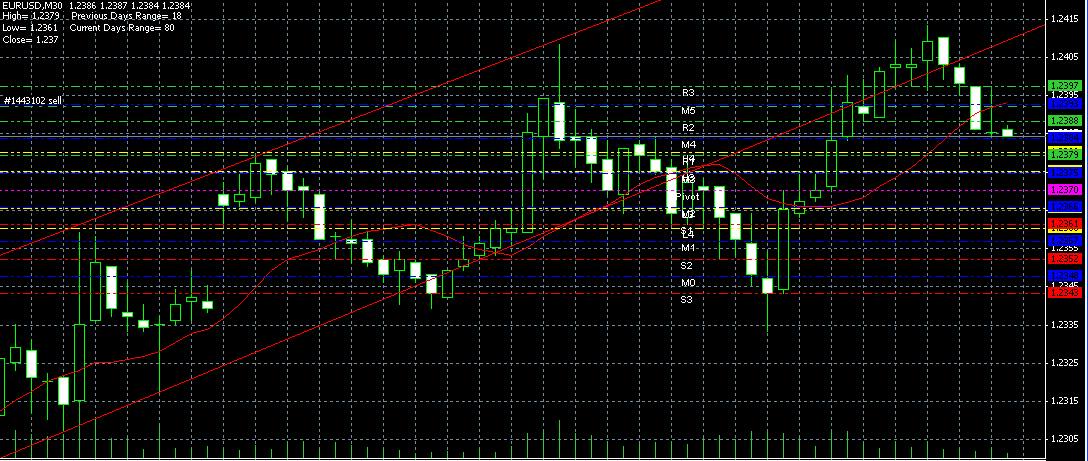
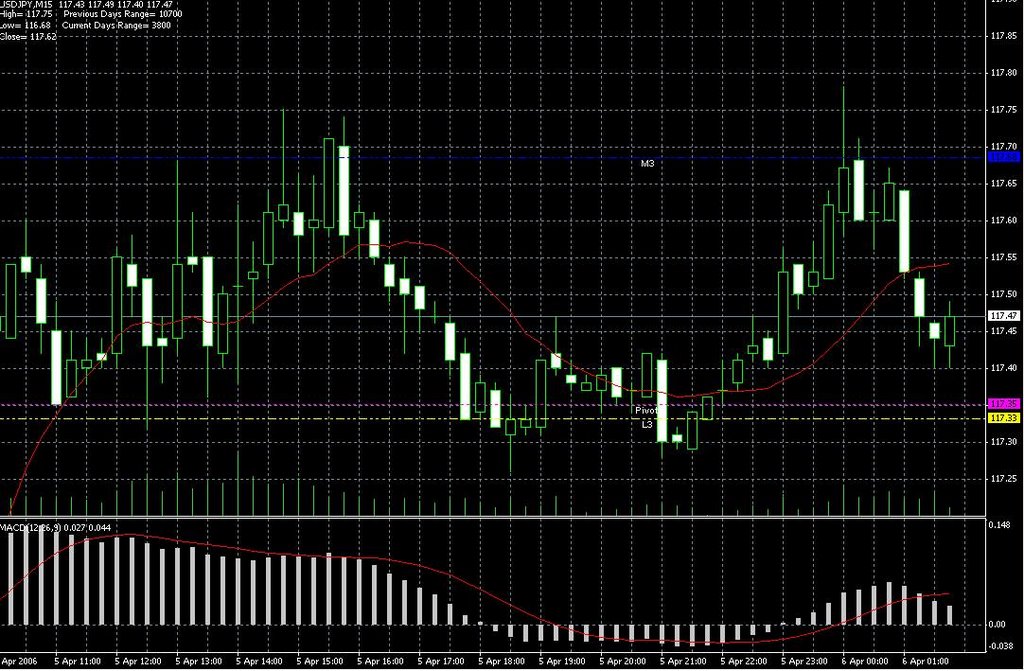
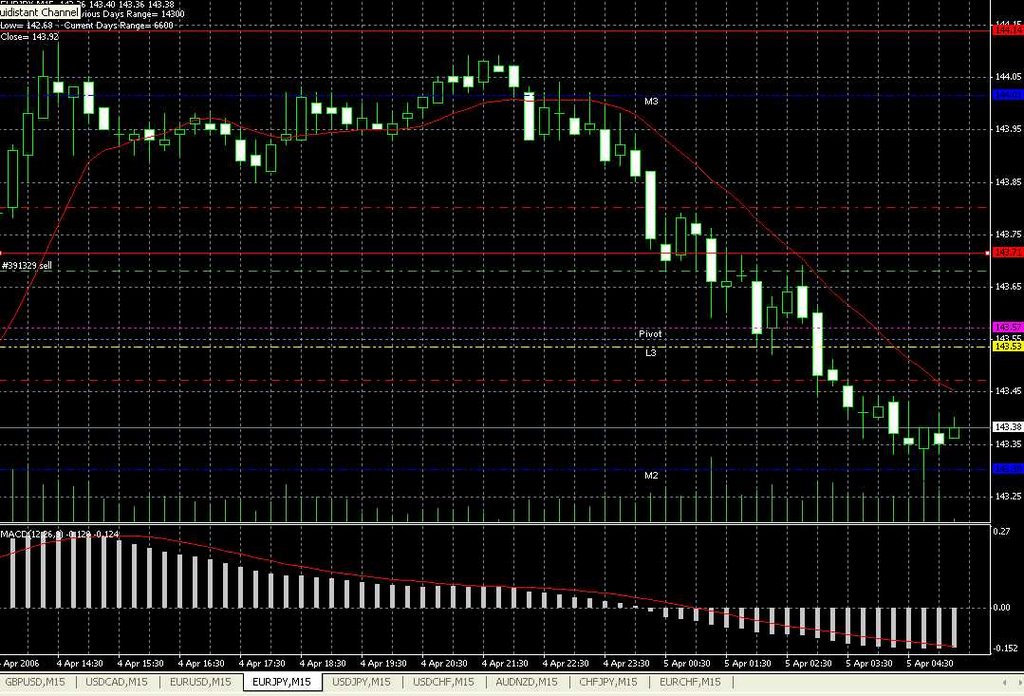
    Fig:2(click to enlarge)

    Our trade does indeed progress in the anticipated manner until it reaches 143.38 . Here we notice that the (downward) trend is again broken and we decide that discretion is the better part of valor - closing our trade @ 143.47 this gave us a profit after spreads of 21 pips or $210 per standard lots (I had 4 lots on this particular trade)

    In my opinion this was a great example of the adage " the trend is your friend" We didn't go against the trend when it was going sideways, we went with it as it fell (Fig 1). Again when our downward trend was broken (Fig 2), we closed out and took our profits rather than hoping it would return to our downward trend.

    OK that's it for today, Good luck!
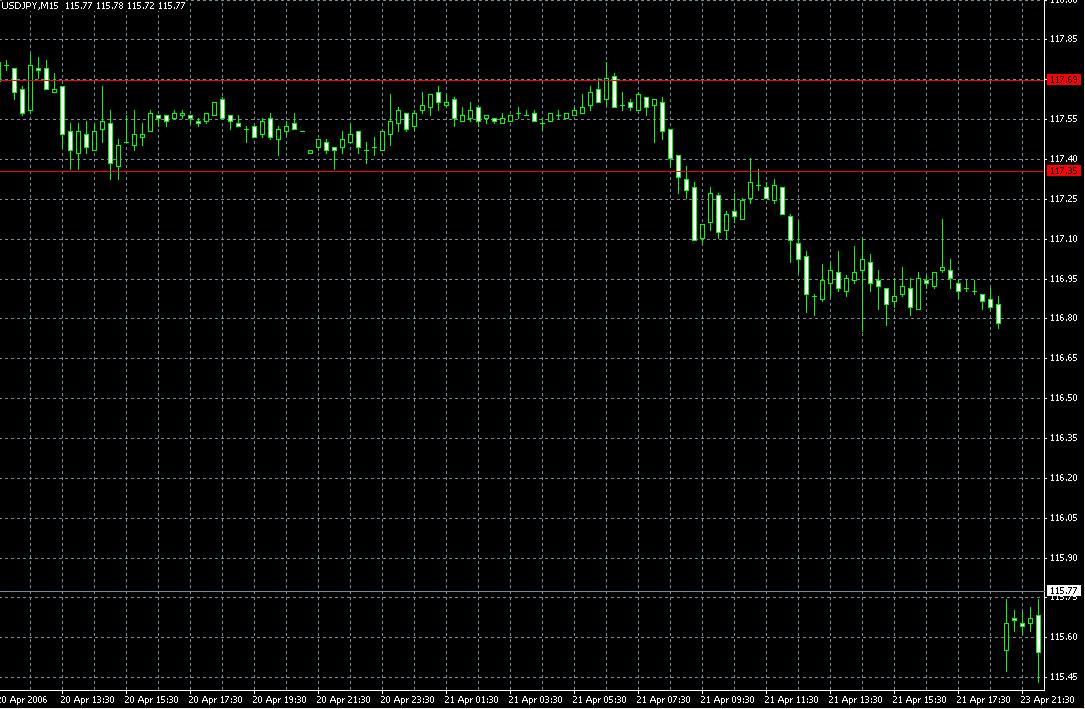
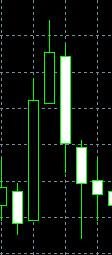
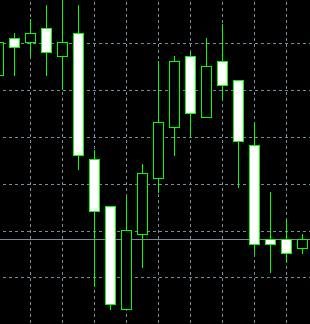
    Wednesday, April 05, 2006

    In the beginning there was.............

    OK! I’ve decided to start writing this blog, to help others as well as myself understand the labyrinth that is the Forex market. After trawling the internet and asking for help in the many forums dedicated to the subject, I came to the conclusion that nobody really had the time to offer their help and thousands of pages on the forex only served to confuse the matter!

    So - Why the forex market? Well after trying various online and offline investments, I became tired and uncomfortable with allowing people to have charge over my money. Banks weren’t really an attractive alternative ( 4% per year anybody? – no thanks! ) and, as a bit of a risk taker, I thought forex offered an attractive - but complicated - opportunity to increase my capital.

    From time to time I may offer my thoughts on other investment opps’ as they make themselves known to me. But, by and large we will just be talking forex.

    I shall be posting some of my trades here with explanations of why I entered the trade and why I closed the trade. If my techie skills will allow, I’ll also post the screenshots.

    I’m intending to give some simple explanations on candlestick formations and will try to post as frequently as time allows.

    Hopefully we can learn together. None of what I write here is intended as advice, and is only my understanding of the method and terminology associated with forex trading – So, please feel free to shoot down any of the reasoning I offer here on these pages. I’m a couple of months in now and I’ve made some money and lost some. But, I can see the light at the end of the tunnel............
    ..........Hopefully it is the light of understanding and not the oncoming train!