USDCAD trade. Month end profit.
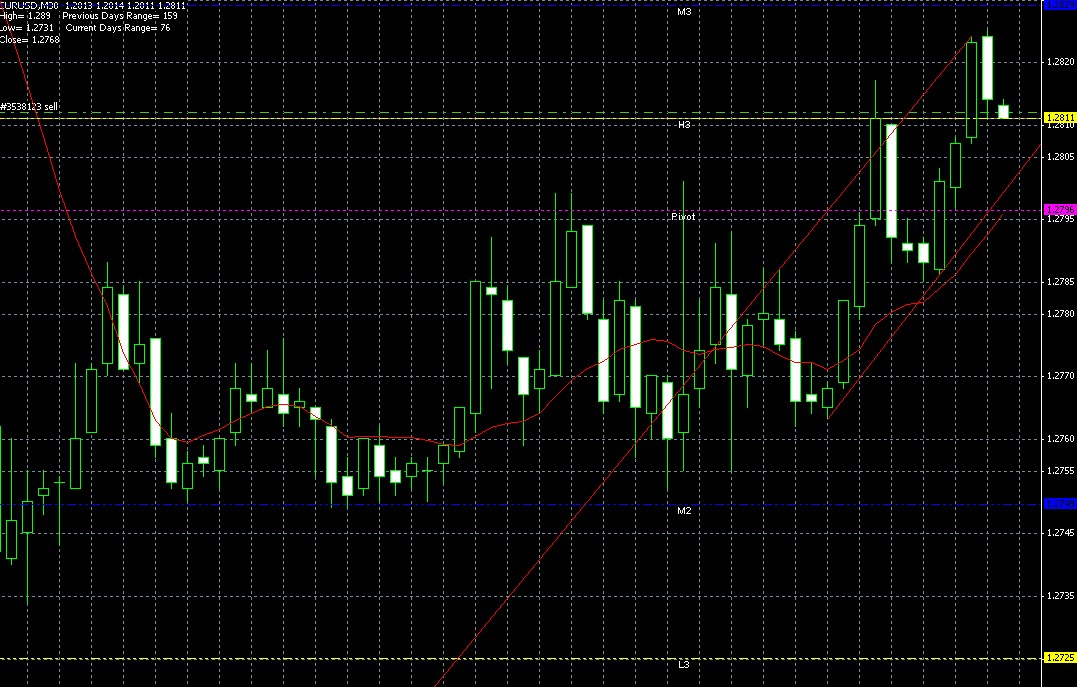
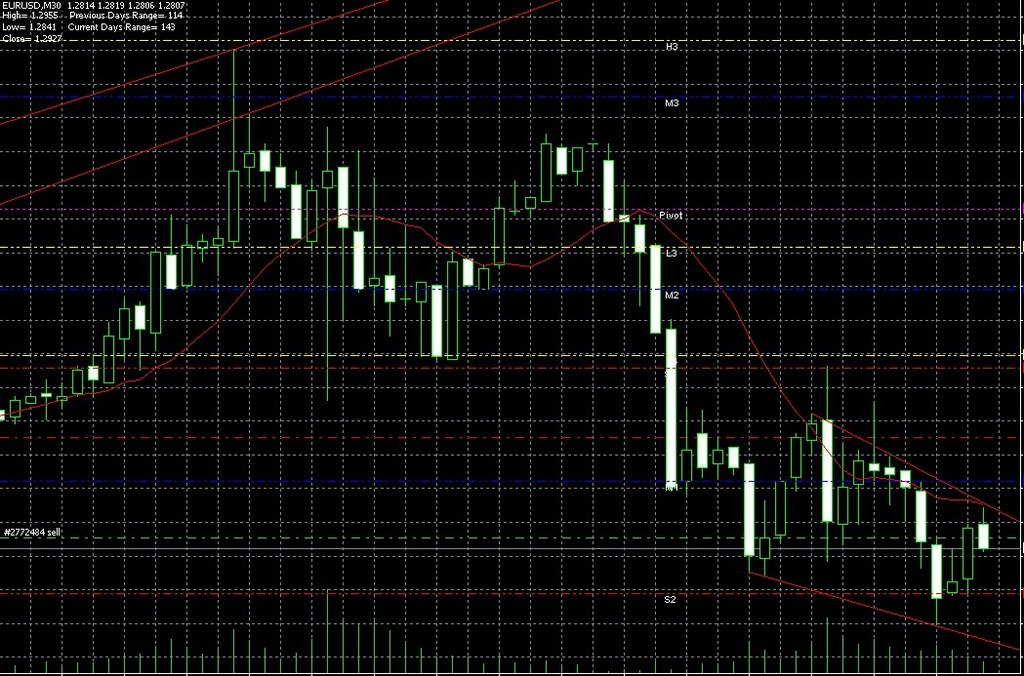
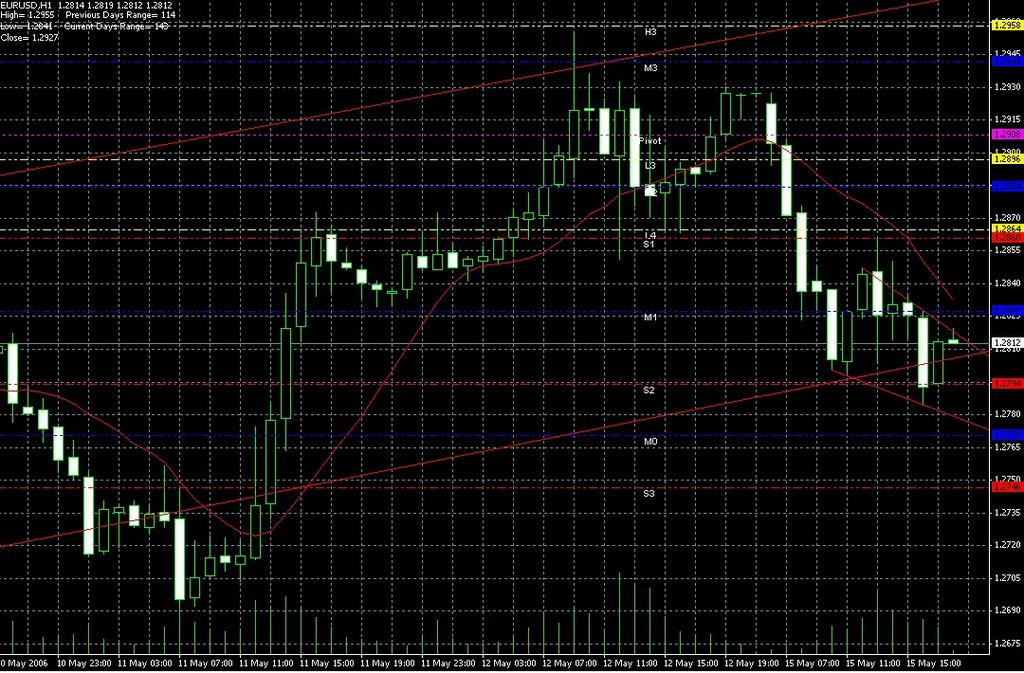
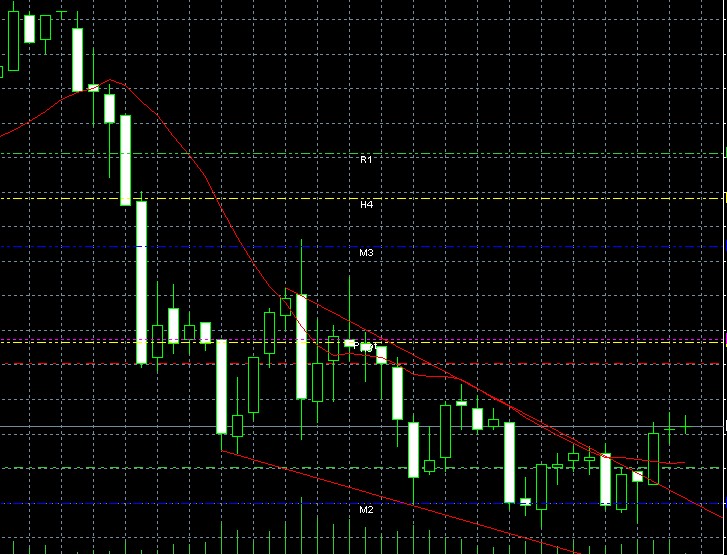
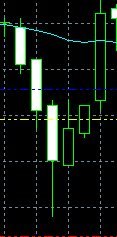
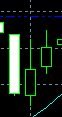
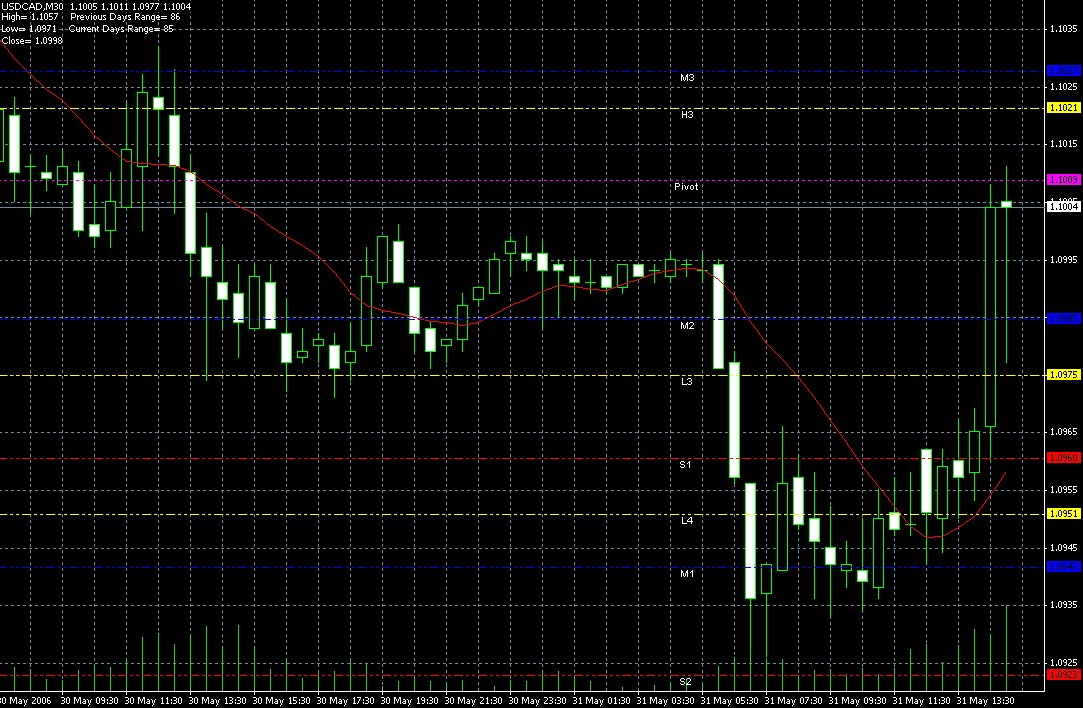 Noticed an engulfing bullish candlestick forming at 1.0940 on the usdcad (thought I'd taken a screenshot - but can't find it!) . If you look on the chart above, which is actually taken after my exit., you'll see a bullish candle open lower than the bearish close but then start to 'overtake' the open of the previos candle. A true engulfing candle would have opened lower but then closed higher than the previous open - which this did not.
However fortune, in this case, favored the brave and I was rewarded with a 34pip gain eventually cashing out when the spinning top appeared at the far right of the image.
This months results are a total of 17.5% profit for the month of May. I'm very pleased with this and shall continue to refine the strategy I'm using at the moment. I am however going to open a demo account on another platform to test out some other trading strategies. I shall of course keep everyone informed.
Good Fortune - Cash
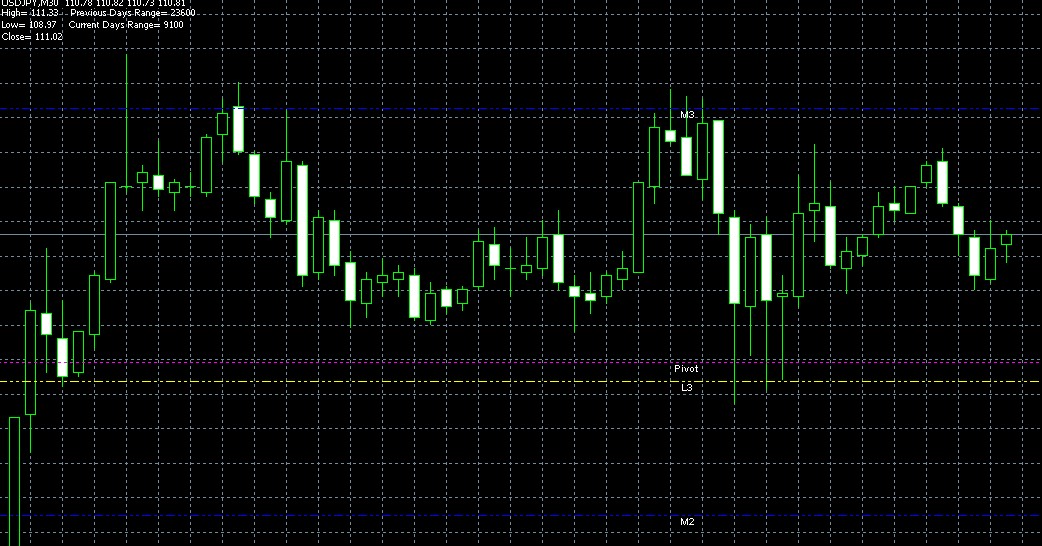
Want to learn more about pivot points? Check out

This is without doubt the best course available at the moment on trading Pivot Points
Subscibe to my Newsletter Click Here!
Forex Courses Reviewed
posted by Midas Joe @ 12:58 PM
0 comments
![]()
![]()