
The Sideways Trend
Sideways Market
The sideways trend is usually seen after an upward or downward market movement. I think it represents a great opportunity for trading, and I love it when I see the market moving sideways – Because it can’t stay that way forever!
Click to enlarge
 As we see in our screenshot, after an upward movement our currency pair is bouncing sideways over a 34 pip range. We place our trendlines on the support (bottom) and resistance (top) price points, and await a move outside the range. In this case we wouldn't want to risk trading the 34 Pips up & down (well I wouldn't!) Also notice in our image how there is huge gapping - bottom right hand corner - as the Forex markets close and open in different regions. Wouldn't want to get caught the wrong side of a move like that! Over a 100 pip drop.
OK let's try to demystify our Japanese Candlesticks a little more, with a couple of bearish indicators.
Todays Japanese Candlestick - Gravestone Doji
 As you might expect these are seen at the tops of an upward trend. As with the Dragonfly we saw on Saturday, the Gravestone has a long tail or wick (but in the opposite direction) and is a stronger indicator of a possible downward movement emerging than the shooting star below.
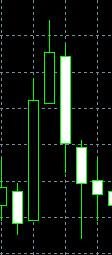
Shooting Star. Possible downward move imminent! Note how our Shooting Star, at the top of our cluster of candlesticks, is followed by a swift downward reversal from the previous upward movement. These are often much "stubbier" with a short body, so keep an eye open, they could mean a profit opportunity is aproaching.
Ok - more later Happy Trading!
Subscibe to my Newsletter Click Here!
posted by Midas Joe @ 12:15 PM
0 comments
![]()
![]()

0 Comments:
Post a Comment
<< Home